
When service behavior changes, teams need a history of measurements to understand what happened and rules that can draw attention to trouble. Prometheus regularly collects metrics from configured targets, stores them as time series and provides a query language for analysis and alert evaluation. It is widely used as a foundation for application and infrastructure monitoring. Storage retention, target discovery and notification routing still need design; a second server does not automatically turn its independent local database into shared durable history.
Current guidance
Its local database is neither clustered nor replicated. Running another replica can improve monitoring availability, but it does not turn two independent data directories into one durable shared history. Choose retention, storage capacity and any remote-storage integration according to the queries and recovery requirements you actually have.
For an existing installation, the Prometheus 3 migration guide matters independently of Helm. Scrape protocol handling, some configuration flags and target-label behavior changed from Prometheus 2. Check exporters that return invalid or missing content types, and review queries or alert routing that depend on exact instance labels. A healthy process can still have missing targets or changed query results.
Before upgrading, retain the scrape configuration, rules and Alertmanager routing, and create a documented TSDB recovery point. Compare target counts, representative recording rules and deliberate test alerts on the candidate. Validate both notification delivery and resolution. Use the current community chart when Kubernetes packaging is needed; its defaults and bundled components are a separate review from the Prometheus server release.
Historical upstream link check · 2026-10-09
The recorded upstream address responded successfully (HTTP 200) on 2026-10-09. GitHub does not mark prometheus/prometheus archived or disabled; this does not establish active maintenance, support or compatibility. Link availability does not certify the historical installation instructions or current security support.
Website availability is separate from project, chart and image support. Use the current guidance and primary sources on this page to assess the distribution.
Historical Kubedex content
Preserved for context. Commands, versions, prices and results below reflect the original research.
Prometheus is an open-source systems monitoring and alerting toolkit originally built at SoundCloud. Since its inception in 2012, many companies and organizations have adopted Prometheus, and the project has a very active developer and user community. It is now a standalone open source project and maintained independently of any company. To emphasize this, and to clarify the project’s governance structure, Prometheus joined the Cloud Native Computing Foundation in 2016 as the second hosted project, after Kubernetes.
For more elaborate overviews of Prometheus, see the resources linked from the media section.
Features
Prometheus’s main features are:
- a multi-dimensional data model with time series data identified by metric name and key/value pairs
- a flexible query language to leverage this dimensionality
- no reliance on distributed storage; single server nodes are autonomous
- time series collection happens via a pull model over HTTP
- pushing time series is supported via an intermediary gateway
- targets are discovered via service discovery or static configuration
- multiple modes of graphing and dashboarding support
Components
The Prometheus ecosystem consists of multiple components, many of which are optional:
- the main Prometheus server which scrapes and stores time series data
- client libraries for instrumenting application code
- a push gateway for supporting short-lived jobs
- special-purpose exporters for services like HAProxy, StatsD, Graphite, etc.
- an alertmanager to handle alerts
- various support tools
Most Prometheus components are written in Go, making them easy to build and deploy as static binaries.
Architecture
This diagram illustrates the architecture of Prometheus and some of its ecosystem components:
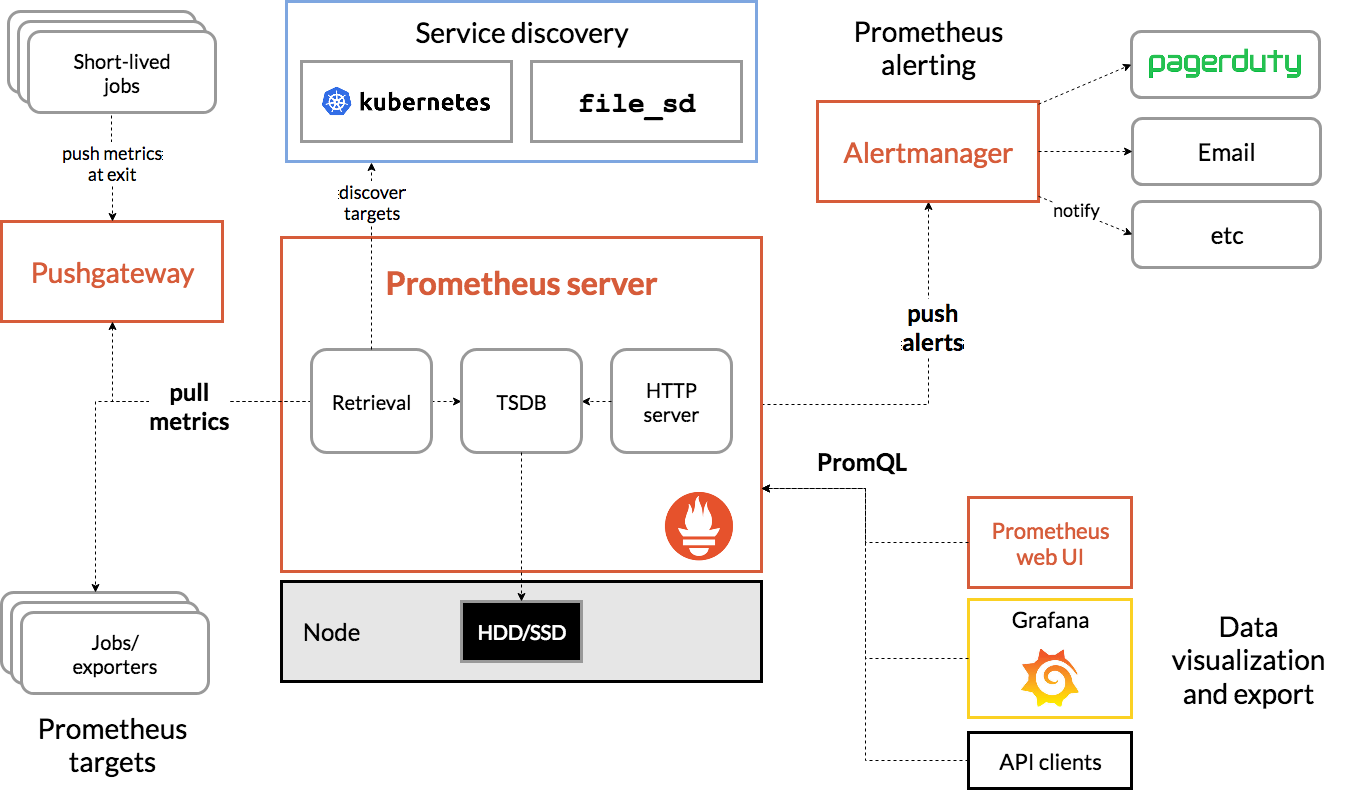
Prometheus scrapes metrics from instrumented jobs, either directly or via an intermediary push gateway for short-lived jobs. It stores all scraped samples locally and runs rules over this data to either aggregate and record new time series from existing data or generate alerts. Grafana or other API consumers can be used to visualize the collected data.
When does it fit?
Prometheus works well for recording any purely numeric time series. It fits both machine-centric monitoring as well as monitoring of highly dynamic service-oriented architectures. In a world of microservices, its support for multi-dimensional data collection and querying is a particular strength.
Prometheus is designed for reliability, to be the system you go to during an outage to allow you to quickly diagnose problems. Each Prometheus server is standalone, not depending on network storage or other remote services. You can rely on it when other parts of your infrastructure are broken, and you do not need to setup extensive infrastructure to use it.
When does it not fit?
Prometheus values reliability. You can always view what statistics are available about your system, even under failure conditions. If you need 100% accuracy, such as for per-request billing, Prometheus is not a good choice as the collected data will likely not be detailed and complete enough. In such a case you would be best off using some other system to collect and analyze the data for billing, and Prometheus for the rest of your monitoring.
Sources & further reading
Spotted something that needs another look?
Help improve this page →